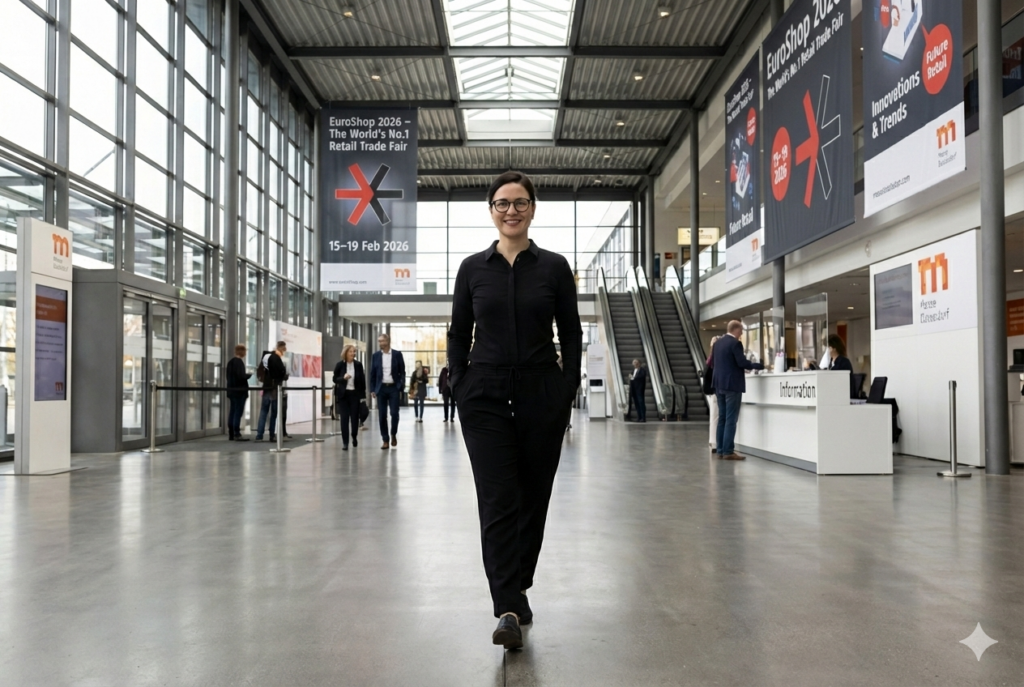
EuroShop 2026: CO2 footprint
Between Retail Innovation and Resource Reality
EuroShop is regarded as the world’s leading trade fair for retail design and shopfitting
— an innovation platform, marketplace, and industry driver in one.
But what ecological and economic implications arise from an event of this scale?
This article examines EuroShop 2026 based on verifiable data, modelled CO₂ calculations, and a critical assessment positioned between marketing strategy, network effects, and resource reality.
1. Classification of the Trade Fair – Key Figures
EuroShop 2026 in Düsseldorf has commenced. It is regarded as the leading international trade fair for retail design, shopfitting, retail technology, visual merchandising, and store staging.
For decision-makers in the retail sector, it serves simultaneously as a benchmark, marketplace, and point of reference.
For the 2026 edition, approximately 1,900 exhibitors from more than 50 countries are expected. In 2023, the fair hosted 1,824 exhibitors. The net exhibition area amounted to 102,927 m² and was FKM-certified.
For 2026, industry sources anticipate a further expansion of exhibition space to approximately 130,000 m². A detailed, officially confirmed net figure has not yet been publicly disclosed at this stage.
The previous edition recorded 81,484 trade visitors from 141 countries. For 2026, attendance is again expected to exceed 80,000 visitors.
Internationality is therefore structurally embedded:
As early as 2023, exhibitors came from 55 nations, and visitors from 141 countries.
Key Figures at a Glance
1,824 exhibitors (2023)
Approx. 1,900 expected exhibitors (2026)
102,927 m² net exhibition space (2023, FKM-certified)
80,000 visitors (2023)
55 exhibitor nations (2023)
141 visitor nations (2023)
Three-year cycle since 1975
This scale makes one point clear: EuroShop is not a small industry gathering, but a global system of temporary architecture, international mobility, and concentrated marketing expenditure.
Link: https://www.euroshop-tradefair.com/en/Facts_Figures
2. Economic Dimension:
Marketing Budget vs. Order Reality
Participation in a leading trade fair of this magnitude represents a strategic investment for exhibitors.
Stand construction, logistics, staffing, travel, accommodation, media production, and accompanying marketing activities quickly accumulate into substantial budgets.
For many sectors — ranging from shopfitting and building services systems (MEP) to retail technology — trade fairs serve as central acquisition platforms. At the same time, the question arises regarding the realistic order intake in relation to the resources deployed.
A robust classification is required:
What are the average trade fair costs per m² of exhibition space?
Which ROI studies exist regarding the trade fair industry?
How has the trade fair sector developed statistically in recent years?
What proportion of the annual marketing budget does participation in a leading trade fair represent?
These questions form the economic foundation upon which ecological assessments can be meaningfully contextualised.
3. Illustrative Calculation:
CO₂‑Footprint of EuroShop
Beyond the economic perspective, a second, less frequently discussed question arises:
What level of emissions is generated by an event of this magnitude?
Anyone wishing to objectively assess their own carbon footprint can do so using established CO₂ calculators, such as those provided by the Umweltbundesamtes or atmosfair transferring this logic to a system of this scale is then simply the next logical step.
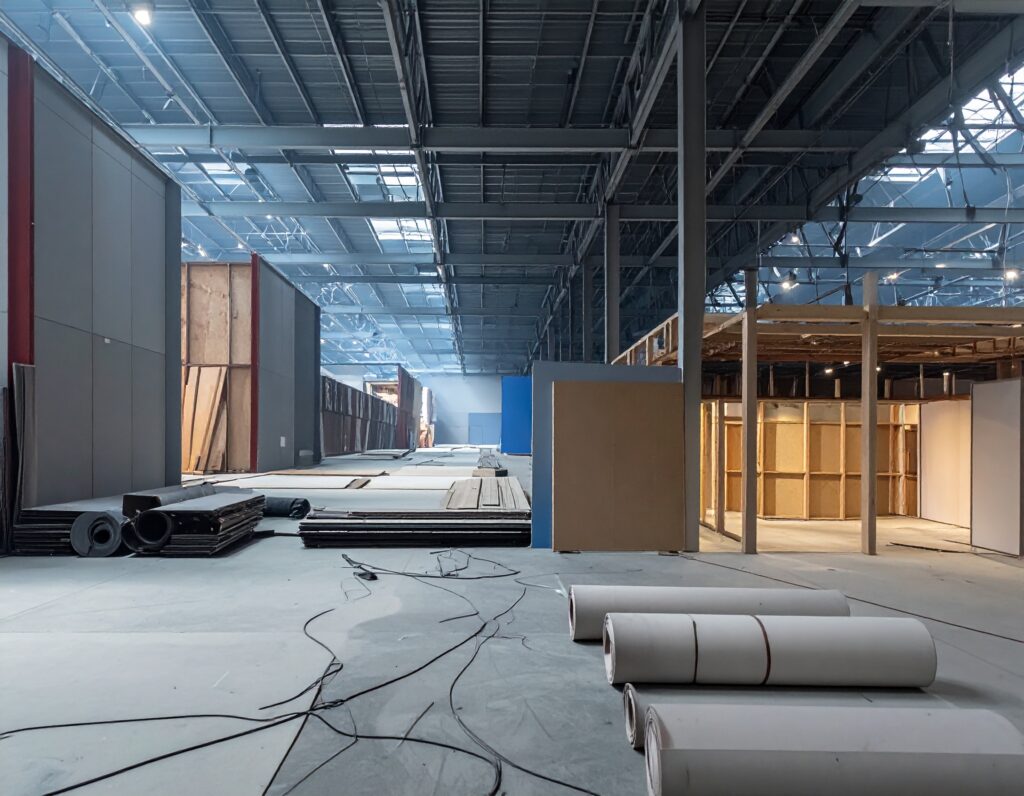
3.1 Exhibitors – Temporary Architecture
Based on the net exhibition area in 2023 (102,927 m²) and 1,824 exhibitors, the calculated average stand size amounts to approximately 56 m² per exhibitor.
For an initial model calculation, the following assumptions are applied (explicitly defined as a model):
Material input per m² of stand area
Emission factor of the material mix (engineered wood products, metal, textiles, graphics)
Logistics effort (transport to and from the venue)
Assembly and dismantling processes
In addition, the following contextual information is considered: According to an industry project on circular economy in the trade fair sector funded by the Deutsche Bundesstiftung Umwelt (DBU), only approximately 1% of recyclable materials from German trade fair events are returned to material cycles.
This figure refers to the overall waste stream, not exclusively to stand construction. Nevertheless, it provides a clear indication of structural deficits in circular material management.
Methodological note:
The calculation should be understood as a simplified, model-based life cycle assessment (LCA) of an average exhibition stand. Selected life cycle phases are considered — material input, transport, assembly/dismantling, and proportional use phase.
Subsequent extrapolations transfer these model values to the overall structure of the trade fair.
This is deliberately presented as a transparent scenario calculation, not as a complete, certified LCA in the scientific sense.
3.2 Visitors – Mobility as the Primary Lever
With more than 80,000 international visitors, the focus of the emissions assessment shifts significantly toward mobility.
For the model calculation, three clusters are defined:
DACH
EU (excluding DACH)
International (intercontinental)
For each group, typical travel profiles and average lengths of stay are assumed.
The illustrative calculation applies a consistent set of rounded emission factors (rail/car/air per passenger-km, hotel per night), as well as modelled average travel distances and modal splits per cluster.
Example Calculation per Visitor
(travel + hotel accommodation, excluding on-site operations)
DACH (avg. 800 km round trip; rail 50% / car 40% / air 10%; avg. 2 nights):
≈ 0.11 t CO₂eEU (avg. 2,000 km round trip; air 60% / rail 20% / car 20%; avg. 3 nights):
≈ 0.38 t CO₂eInternational (avg. 12,000 km round trip; air 90% / rail 5% / car 5%; avg. 4 nights):
≈ 2.54 t CO₂e
Assuming a modelled visitor structure of 40% DACH / 35% EU / 25% International,
a weighted average of approximately 0.81 t CO₂e per visitor results.
Even this conservative modelling indicates:
Travel-related emissions may significantly exceed the footprint of stand construction alone.
3.3 Systemic Blind Spots
Not included — and therefore often invisible — are:
Energy demand of the exhibition halls
Temporary flooring systems and wayfinding infrastructure
Catering infrastructure
Waste management processes
These indirect components are integral to a comprehensive system-level assessment of an international leading trade fair.
3.4 Quantitative Summary: Emissions vs. Output
Based on the previously described modelling assumptions, the overall system can be condensed into two primary blocks:
Block A – Supply Side (Exhibitors / Stand Construction)
Average stand size (approx. 56 m² calculated mean)
Modelled lifecycle footprint per exhibitor presence:
≈ 3.6 t CO₂eExtrapolated to total fair scale (1,824–1,900 exhibitors):
≈ 6,600–6,900 t CO₂e
Block B – Demand Side (Visitors / Mobility)
81,484 trade visitors (2023)
Weighted average per visitor (DACH / EU / International, incl. hotel):
≈ 0.81 t CO₂eTotal extrapolated emissions:
≈ 66,000 t CO₂e
This results in a modelled total magnitude for the event in the range of
≈ 73,000 t CO₂e (stand construction + visitor travel, excluding hall operations).
Contextualising the Scale:
A single international visitor (≈ 2.5 t CO₂e) generates emissions equivalent to roughly one quarter of the average annual per capita CO₂ footprint in Germany — concentrated within only a few days.
The total trade fair footprint of ≈ 73,000 t CO₂e corresponds to the annual emissions of several tens of thousands of average households, or to the emissions associated with millions of passenger car kilometres.
The distinction lies in purpose:
Private air travel is associated with leisure, family, and personal quality of life — values that are not monetised.
In a trade fair context, emissions are directly linked to defined economic objectives: revenue, market share, and strategic positioning.
For this reason, the ratio of emissions to output becomes economically relevant.
Cross-Industry Benchmarks from Trade Fair and Event Studies
Industry-wide analyses typically indicate the following ranges:
- Exhibitor ROI ratio: approximately 3–5:1
(3–5 euros in revenue per 1 euro invested in trade fair participation), in some cases higher. - Revenue impulse: multiples of trade fair costs generated within a 6–24 month sales pipeline.
- High contact intensity: on average 13.1 business contacts per trade fair day;
a significant share of respondents state that this quality of interaction cannot be fully replaced digitally.
- Exhibitor ROI ratio: approximately 3–5:1
For visitors, there is no classic ROI metric in the sense of “3–5:1”.
The AUMA study “Value Added of Trade Fair Visits” indicates:
Visitors average 13.1 business contacts per trade fair day.
93% consider trade fairs decisive for their purchasing process.
46% are already in the final phase of their buying decision.
On average, more than five separate business trips per day are avoided due to the concentration of contacts at the fair.
Visitor ROI is therefore not a direct cash return, but a concentration of decision maturity, market transparency, and travel efficiency.
Emissions per Revenue Impulse
Applying these benchmark ranges illustratively to EuroShop yields the following scenario:
If an exhibitor invests €150,000 in their trade fair presence
and achieves a conservative ROI range of 3–5:1,
the resulting revenue impulse would lie between €450,000 and €750,000 over the subsequent period.
This would correspond to modelled emissions of ≈ 3.6 t CO₂e per appearance.
The perspective therefore shifts from absolute emissions to proportionality:
How many tonnes of CO₂ are associated with the generated revenue volume?
In the above scenario, this would amount to approximately 4.8–8 kg CO₂e per €1,000 revenue impulse.
This figure is not a moral judgement, but an economically interpretable indicator.
It requires emissions and performance to be assessed within the same analytical framework.
The central question is therefore not:
“Are trade fairs good or bad?”
But rather:
“Is the CO₂ input per unit of strategic market access acceptable
for your business model — and is it being measured?”
This ratio — not the absolute emission figure — becomes the relevant benchmark.
4. Social Dimension of Trade Fairs
Network Effects of Trade Fair Participation
Trade fairs function as physical concentration spaces for:
Business matching
Knowledge transfer
Innovation acceleration
In times of increasing digitalisation and AI adoption, face-to-face interaction demonstrably gains relevance.
The question is not whether the network effect exists — but how strong it is in relation to the resources deployed.
Social Gap
In parallel, a less frequently discussed dimension emerges:
Hotel price inflation during trade fair periods
Personnel commitment over multiple days
Opportunity costs, particularly for SMEs
Leading trade fairs are marketplaces — but also access barriers.
For smaller companies, participation represents a disproportionately high financial risk.
5. The Silent Credit of CO₂ Consumption in Trade Fair Construction
Marketing activities are frequently regarded as a business necessity.
Yet every temporary structure, every journey, and every emission represents an implicit ecological credit.
The central question is:
Are these emissions — particularly business travel and trade fair participation — systematically incorporated into Scope 3 accounting?
And if so: with what level of transparency?
This is the critical interface between growth strategy and sustainability reporting.
6. Perspective: Rethinking Sustainability in Trade Fair Construction
Sustainable construction does not solely mean refraining from new builds or preserving existing structures.
Applied to trade fair construction, it implies:
Modularity instead of single-use architecture
Reuse instead of disposal
Rental systems instead of ownership structures
Digital augmentation instead of full physical substitution
Alternative strategies for order generation
Such alternatives may include:
Digital showrooms
Roadshows using reusable modules
Cooperative appearances instead of individual stands
Hybrid formats
These approaches can generate comparable visibility — with significantly lower resource intensity.
7. Concluding Question & Decision Framework
Have you consciously decided for or against trade fair participation — or are you following an established industry reflex?
If you participate:
Do you know the emissions of your appearance?
Do you know the realistic revenue leverage?
Do you know the ratio between the two?
If you do not participate:
Which alternative strategy replaces the contact density, decision maturity, and market transparency of a leading trade fair?
The relevant question is not
whether trade fairs are inherently beneficial.
Rather: Are decisions based on robust metrics — or on habit?
I support companies in making this strategic evaluation transparent:
economic output in relation to resource input — fact-based rather than reflex-driven.